Agent / Broker Mergers & Acquisitions
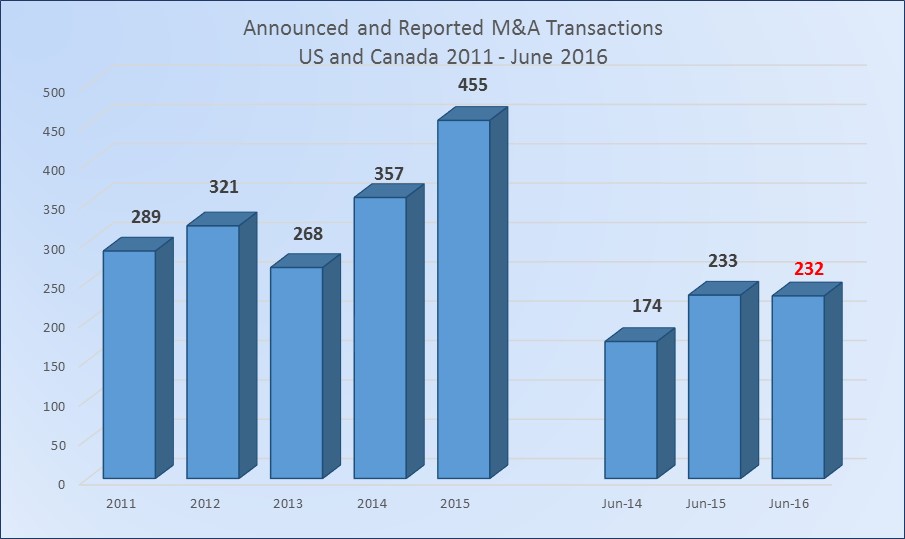
While brokers’ merger and acquisition (M&A) activity fell short of setting any records during the first half of 2016, buyers and sellers continued to feed their hearty appetites for deals and push up the M&A activity trend line. First-half 2016 activity dropped nominally to 232 announced deals from 233 during the same period last year, yet the first two quarters this year rank as the second-most active six-month period since OPTIS began tracking M&A transactions in 2008.
First-Half M&A Activity
As the following chart shows, agency M&A activity has been on a fairly steady climb over the past 4+ years, other than the spike at the end of 2012 and related drop in early 2013 related to the tax law change.
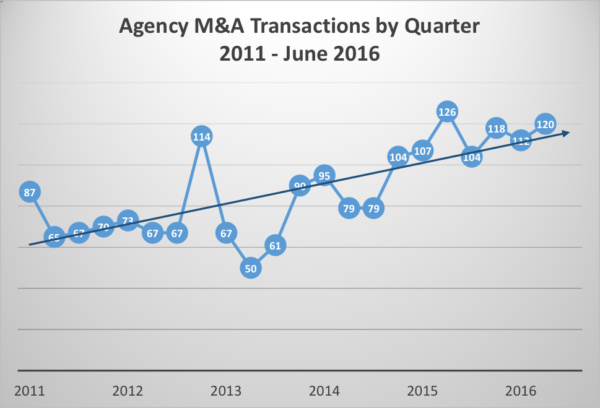
First-half M&A activity this year also extended the trend of 100 or more transactions to seven consecutive quarters. The last three-month period when brokers did not complete at least 100 deals was 2014’s third quarter.
The M&A count during the first half of 2016 was essentially flat compared with first-half activity last year and up slightly from the last half-year in 2015. We anticipate the recent strong industry-consolidation trend will continue for the near term as acquisitions are an important growth strategy for many firms, especially those backed by private-equity capital. Of course, that projection does not account for any significant, unforeseen financial, political or economic events that would change the underlying M&A market.
PE-Backed Brokers Still Driving M&A Activity
As they have every year since 2012, brokers backed by private-equity capital were by far the most-active group of buyers during the first half this year with 114 of the 232 announced deals. While that activity represents a dip to 49% of all transactions compared to nearly 58% during 2015’s second half, it is on par with last year’s first-half activity.
Privately-owned brokers were the second-most active group of buyers with 68 deals—or 29%, up from 24% during the year-earlier period. Publicly-traded brokers announced 24 deals, or a little more than 10% of the total, down three deals from last year’s first-half count.
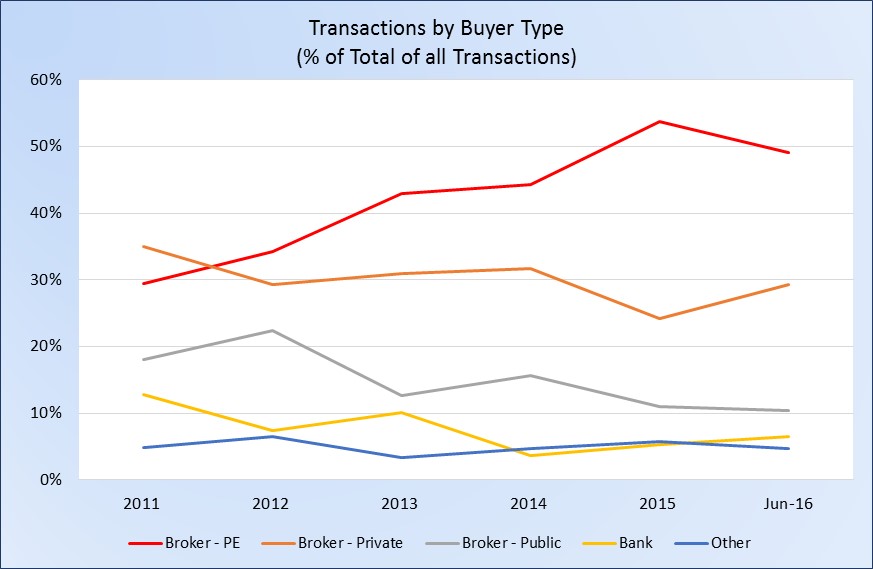
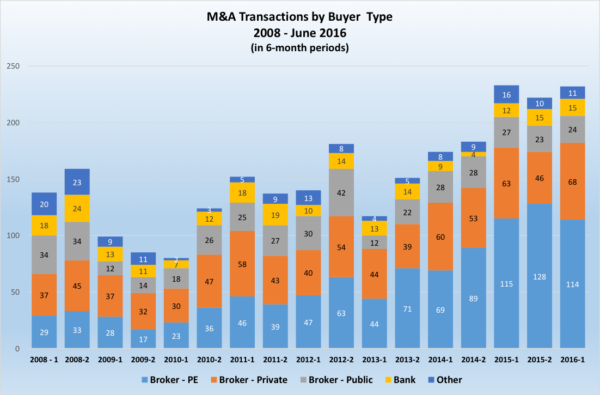
Financial institutions continue to account for less than 10% of M&A activity, a level they fell to in 2012, but the first half of 2016 marks the third consecutive six-month period of sustained or growing activity for the group. Banks announced 15 transactions, three more deals than during last year’s first half and equal to the total during last year’s second half. During the full year in 2011, financial institutions announced 37 deals, the only period other than 2008 when banks completed more than 30 deals. Insurance companies and other buyers also were less active the first half this year compared to the first six months of 2015 and remain a relatively inactive group.
M&A Transactions by Buyer Type
In 2008, PE-backed brokers were only the third-most active group of buyers, with privately-held brokers ranking first and publicly-traded firms second. But after the financial crisis developed in September 2008, private equity focus on the insurance distribution sector has grown dramatically. From 2009 through 2011, PE-backed brokers were the second-most active group of buyers, and then pulled ahead of all other types of buyers in 2012.
The second half of 2015 marked the first time any group of buyers accounted for 50% or more of all transactions. Indeed, PE-backed brokers were so active during the second half last year—representing the buyers in nearly 58% of all deals—that they also accounted for more than half—54%—of the total number of deals for the full year. While PE-backed brokers’ M&A activity experienced a modest drop-off from its record level during the second half of 2015 level, the investment environment suggests this group of buyers will continue to view insurance distribution as a solid return-on-investment opportunity.
Buyer Group Trends
Looking at the trend of the number of buyers for the three most active buyer groups (Privately owned, PE-backed and Publicly traded), the chart below illustrates the number of buyers from each of the three groups for each semi-annual period from 2008:
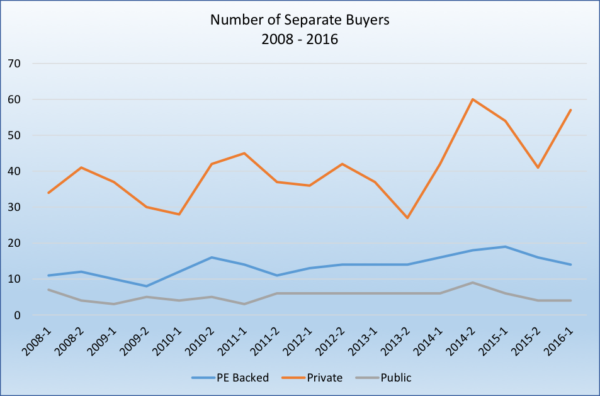
As they have been since we started tracking M&A activity, privately-owned brokers have the largest number of active participants, finishing with 57 firms announcing deals through June, 2016. But those buyers announced only 68 deals—or slightly more than one acquisition per firm on average.
2008 vs. TTM June 2016
As shown in the chart below based on activity for 2008 vs. the TTM period ending June, 2016, the average number of transactions per buyer varies widely across the different buyer groups, and has become much more concentrated since 2008.
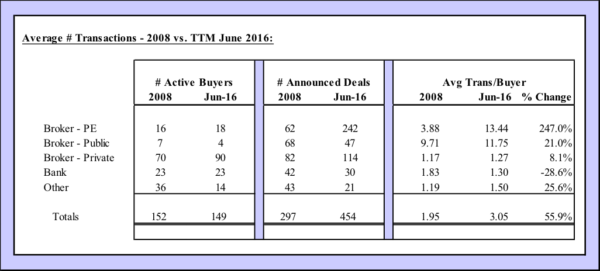
The PE-backed firms announced an average of over 13 transactions over the past 12 months, up from just under four deals in 2008, and well in excess of the average number of acquisitions by the privately owned group of buyers.
Most-Active Individual Buyers
Among the 10-most active buyers, as ranked by six-month totals through June, seven are PE-backed brokers—including the three most-active firms. Acrisure reported the most transactions—28, nine more than during the same period last year. Hub International completed 20 transactions—three more than last year, and AssuredPartners announced 17—just one fewer than a year ago. Publicly-traded Gallagher was the fourth most-active buyer with 16 deals—the same number it announced during the first half last year. Rounding out the top five buyers was PE-backed BroadStreet Partners with 12 deals—one more than a year ago. Four of the five most-active buyers—the exception being AssuredPartners—announced as many or more deals over the TTM period as they did during calendar 2015.
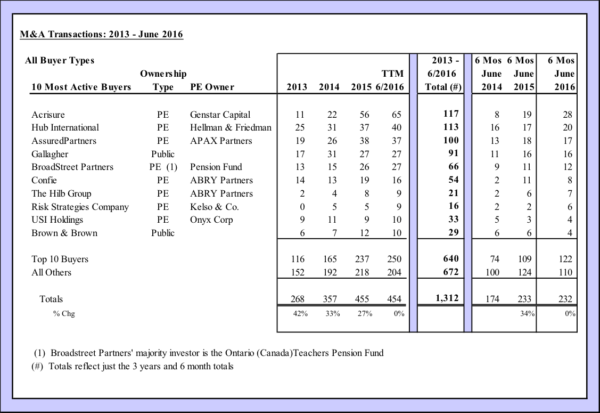
The remaining buyers on the 2016 10 most-active list, like the other 88 buyers during the first half, announced transactions numbering in the single digits. Eight buyers announced five or more deals this year compared to 11 firms during last year’s first half while 70 brokers reported only one acquisition each during the first six months this year, down from 77 during the Jan-Jun period in 2015, but up from 55 for the Jul-Dec period last year.
Among the 98 unique buyers during the first half of 2016, a few were more active than they were during the same period last year. Those reporting the largest increases were Acrisure, with nine more deals in 2016, Risk Strategies, four, and Digital Insurance and HUB, three more deals each. NFP had the largest decrease, with five fewer deals in 2016, followed by Integro, with four fewer, and Patriot National and Confie, both with three less announced transactions.
Seller Groups
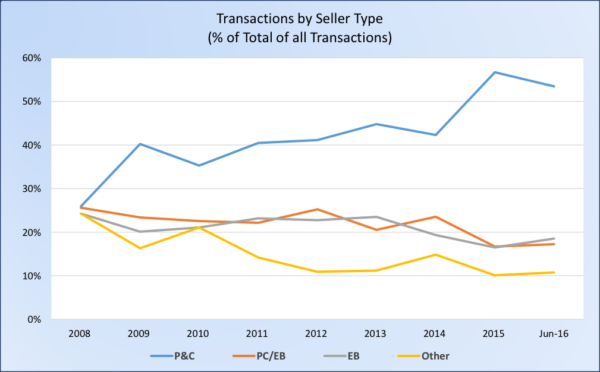
Eight years ago, all four seller groups—Property and Casualty firms, P&C/Employee Benefits firms, EB firms, and Others, such as Wholesalers, Managing General Agents and Managing General Underwriters—each accounted for roughly one-quarter of all acquisitions. Since 2009, P&C firms have emerged as the dominant seller group. In 2015, that group broke the 50% threshold, accounting for 57% of acquisitions. That figure slipped somewhat during the first six months this year but still exceeded half of all transactions at 53%.
Reported Transactions by Seller Type
Examining the raw acquisition numbers among seller groups, however, provides a broader perspective. While P&C/EB and EB agencies now represent a far lower percentage of transactions than they did several years ago, the number of acquisitions involving these types of agencies has remained relatively stable. However, because of the significant expansion in the number of the P&C transactions, the percentages as shown in the table above have moved accordingly.
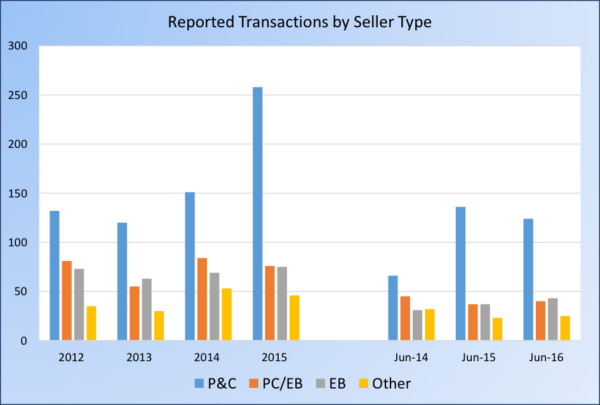
The number of P&C agencies being acquired has exploded over the past couple years, nearly doubling between 2012 and 2015. First-half 2016 acquisition numbers in this group are down slightly from the same period a year ago, but they are still nearly double 2014’s first-half total.
Among the sellers during the first half, there were not any that ranked among the top 100 agencies during 2015. From 2010 through 2015, a total of 25 top-100 firms agreed to sell, with between two and eight of those firms acquired annually.
Summary
Although M&A activity during the first half of 2016 was essentially flat compared with last year’s first half, it remains at a near-record-high level. Barring any unforeseen economic, financial or political developments that change the underlying market, we expect that the current trends driving M&A activity will continue.
The U.S. economy continues to improve. While insurance prices in the P&C segment continue to soften according to the Council of Insurance Agents & Brokers’ most recent market survey, the deterioration of insurance pricing is not significant and is being offset to some degree by growth in exposures and coverages. Interest rates remain at historic lows, minimizing the cost of borrowed funds used for acquisitions, especially with the PE-backed group.
Private equity capital, which has been behind the preponderance of agency acquisitions over the past several years, is still abundant. Investors continue to find the U.S. insurance distribution market opportunistic for an adequate return on investment. To ensure that they are the successful suitors of brokerages expected to deliver attractive returns, PE-backed buyers have been willing to value agencies at or near historical levels.
At some point, however, agency valuations and M&A activity likely will return to more sustainable levels. Whether we are beginning to see that transition with the results through June, or just a minor aberration in the timing of transactions is unclear at this point. Still, as we have commented previously, if you are an agency owner pondering about the best time to put your agency in play, strongly consider taking action sooner than later. Relative to historical trends, interest from buyers is high and agency valuations are near their peak, so now may be the time. If you are a buyer, be cautious about trying to compete with the high multiples in the marketplace. A premium price paid for acquisition can have significant adverse implications on the long-term viability of your agency if the acquired entity does not perform according to expectations and you do not have the capital base to absorb the shortfalls.
Table A – Summary of Announced Transactions 2006 – June 2016
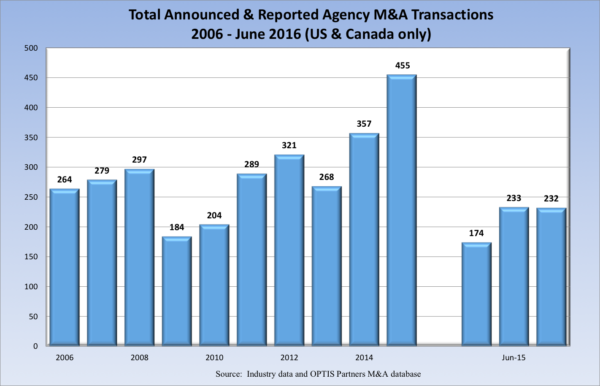
Table B – List of Major Buyers by Type, 2013 thru June 2016 (Private Equity Backed Buyers)
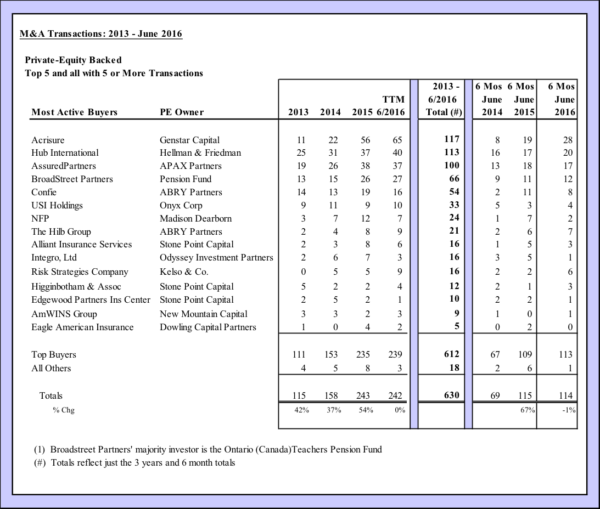
Table C – List of Major Buyers by Type, 2013 thru June 2016 (Privately Owned Buyers)
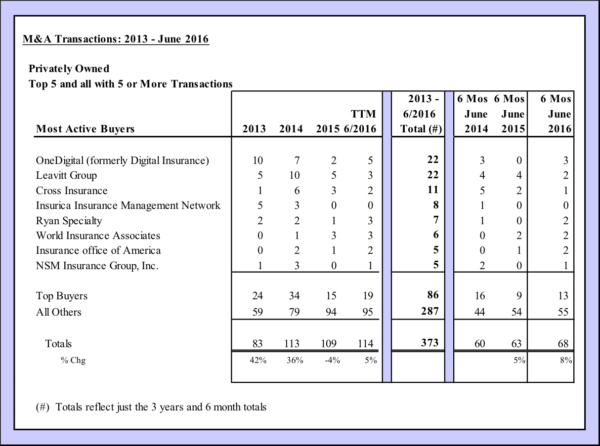
Table D – List of Major Buyers by Type, 2013 thru June 2016 (Publicly Traded Buyers)
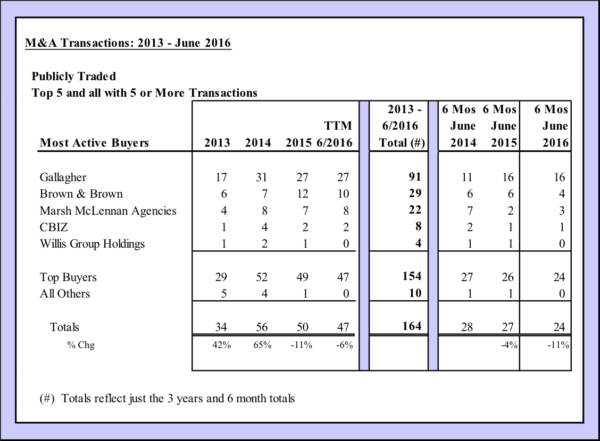
Table E – List of Major Buyers by Type, 2013 thru June 2016 (Bank/Bank Owned Buyers)
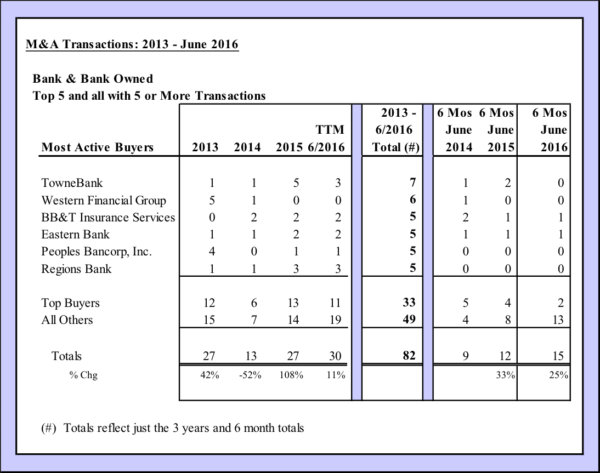
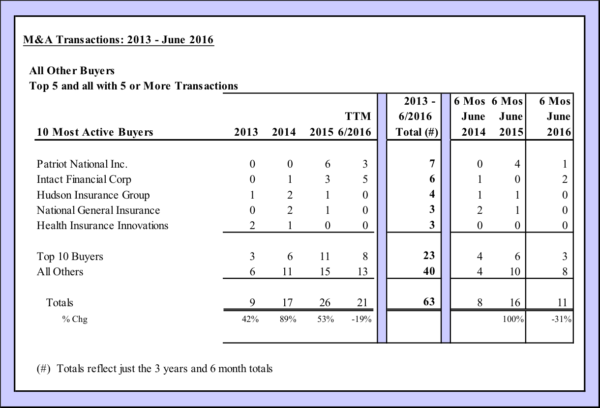
Table F – List of Major Buyers by Type, 2013 thru June 2016 (All Other Buyers)
Explanation and sources of data:
Data is for U.S. and Canadian transactions in the insurance distribution sector for both retail and wholesale producers, including managing general agencies/managing general underwriters (MGA/MGU). These agencies and brokers provide property and casualty (P&C) insurance, employee benefits (EB), life/financial (L/F) services or any combination thereof.
Firms with private equity (PE) backing are identified in the charts above
An appendix of tables follows the report
Data for reported and announced transactions have been obtained from various sources, including press releases, trade press articles, company websites and direct communications with buyers.